The Relationship Between Muscle Strength and Body Composition Measures and Cancer-Related Fatigue: A Systematic Review and Meta-Analysis
Problem Identification: Cancer-related fatigue (CRF) substantially affects daily living and quality of life, but objective CRF measures remain limited. This review aimed to identify the correlation between muscle strength and body composition measures and CRF, as well as potential objective indicators for assessing CRF.
Literature Search: PubMed®, MEDLINE®, CINAHL®/PsycINFO®, and Embase® were searched for studies published from January 2000 to January 2021.
Data Evaluation: Study selection and quality assessment were conducted using the Critical Appraisals Skills Programme checklist and the Strengthening the Reporting of Observational Studies in Epidemiology statement. Comprehensive Meta-Analysis software was used to perform meta-analysis.
Synthesis: 25 studies were selected, and 19 measures were analyzed. CRF negatively correlated with hand grip strength, knee extensor strength, and the sit-to-stand test. No significant correlation was found between body composition measures and CRF.
Implications for Nursing: The evidence suggests that muscle strength measures may be potential indicators for CRF assessment. Combining objective and subjective CRF assessments could assist clinicians in evaluating the effectiveness of CRF interventions more accurately.
Jump to a section
Research has revealed that cancer-related fatigue (CRF) is one of the most frequently reported symptoms in patients with cancer and survivors (Agasi-Idenburg et al., 2017). According to a systematic review by Al Maqbali et al. (2021), the prevalence of CRF ranges from 11% to nearly 99%, depending on the patient’s clinical status. CRF can be experienced before treatment onset and can increase during treatment with radiation therapy, chemotherapy, and hormonal and biologic therapies (Bower, 2014). CRF is also frequently associated with psychosocial factors, such as depression and anxiety (Yennurajalingam et al., 2016), and other cancer-related symptoms, such as chronic pain, insomnia, and nausea (Imayama et al., 2013). Compared with other symptoms, CRF is more distressing and often longer lasting, with a substantial impact on daily living and quality of life (Weis, 2011).
Proper assessment is the first step for managing CRF. However, fatigue lacks a widely accepted definition (Schvartsman et al., 2017; Veni et al., 2019). The limited consensus on fatigue has led to the development of a large number of different scales to measure CRF (Minton & Stone, 2009). Because fatigue instruments are primarily subjective in nature and most frequently measured using self-report scales (Finsterer & Mahjoub, 2014), attempts to evaluate CRF through objective measures remain limited (Veni et al., 2019). In addition, CRF may not always be sufficiently described and reported by patients using subjective scales and questionnaires (Canella et al., 2018; Finsterer & Mahjoub, 2014). Therefore, the use of perceptual, objective measures can help to evaluate fatigue more concretely (Platt et al., 2015).
The multifactorial etiology of CRF, such as cytokine dysregulation, hypothalamic-pituitary-adrenal axis dysfunction, circadian rhythm disruption, serotonin dysregulation, and vagal afferent nerve activation, has been explained in several studies (Barsevick et al., 2010; Morrow et al., 2002; O’Higgins et al., 2018; Ryan et al., 2007). Broadly, fatigue may arise from central and peripheral mechanisms. It has also been demonstrated that chemotherapy agents increase reactive oxygen species production as an outcome of the redox cycling process (Moradi-Marjaneh et al., 2019; Yang et al., 2019), which is related to adenosine triphosphate (ATP) synthesis (Bai et al., 2011). Most studies distinguish central fatigue—a decrease in the muscle’s neural activation because of numerous spinal and supraspinal factors (Gandevia, 2001; Veni et al., 2019)—from peripheral fatigue and attenuated contractile response to neural input induced by biochemical changes at the myocyte level (Debold, 2012). Both peripheral and central fatigue can result in a loss of muscle strength and muscle mass, but whether decreased or increased muscle strength and/or muscle mass affects CRF is unclear (Ryan et al., 2007; Stone & Minton, 2008).
Skeletal muscle is a highly metabolic organ requiring adequate ATP generation. Therefore, reduced ATP generation ultimately leads to skeletal muscle dysfunction (Yang & Hendrix, 2018). Failure to replenish ATP compromises muscle function and decreases the ability to perform physical work, resulting in fatigue (O’Higgins et al., 2018). Watanabe et al. (2013) further indicated that muscle quality represents the portion of the contractile structure in skeletal muscle tissue, which is related to strength in middle age and older adults (range = 51–91 years). Muscle quality, including muscle mass, intramuscular fat, and fat mass relative to muscle volume, comprise body composition (Mankowski et al., 2015). Therefore, body composition reflects muscle tissue’s real functional capacity, indicating an essential determinant of strength (Rech et al., 2014; Watanabe et al., 2013).
There is growing evidence that objective measures of muscle strength and body composition can characterize physical capability and may act as effective markers of current and future health issues, such as fatigue (Cooper et al., 2011; Newton et al., 2018). However, evidence of muscle strength and body composition as indicators of fatigue in the cancer population is limited (Kisiel-Sajewicz et al., 2013). To the authors’ knowledge, no systematic review has examined the relationship between muscle strength and body composition measures and CRF to identify possible indicators for assessing CRF. Therefore, the aims of this systematic review were to: (a) identify the correlation between muscle strength and body composition measures and CRF and (b) explore potential objective indicators for assessing CRF.
Methods
The review protocol has been registered in the Prospero Centre for reviews and dissemination (ID CRD42020157350). The systematic review was performed based on the PRISMA (Preferred Reporting Items for Systematic Reviews and Meta-Analyses) guidelines.
Search Strategy
A literature search was conducted in the databases of PubMed®, MEDLINE®, CINAHL®/PsycINFO®, and Embase® for articles published from January 2000 to January 2021. The search strategy was based on the synonyms and medical subject headings of the following keywords: cancer or cancer survivors and fatigue and muscle strength, dynamometer, hand strength, quadriceps muscle, muscle weakness, muscle fatigue, or anthropometry, and/or body composition, body fat distribution, or body mass index, without language restrictions. References of the included studies were screened for additional articles.
Study Selection Criteria
Studies were included if they met the following criteria for eligibility: (a) the study population was limited to adult individuals with CRF, (b) objective methods of examining muscle strength and/or body composition were used, and (c) the relationship between CRF and muscle strength and/or body composition was investigated. Studies were excluded if only subjective self-report instruments were used and if the correlations between fatigue and muscle strength and/or body composition measures were not reported. All titles and abstracts were screened for inclusion and exclusion criteria by one researcher (C.-C.L.). The full texts of relevant studies were obtained, and two reviewers (S.-C.S. and C.-C.L.) discussed and applied the defined criteria for study selection.
Quality Assessment
Quality assessment included evaluating each study’s methodologic quality and measurement properties to determine the credibility of findings, as well as its use of reliable, objective measures associated with CRF. Methodologic quality was assessed using the Critical Appraisals Skills Programme (CASP, 2018) checklist for randomized controlled trials (RCTs). The CASP checklist consists of 12 questions that evaluate the validity of study results, the statistical analysis of the results, and the conclusion/impact of the study results, as well as measure specific criteria and assess each study for recruitment, study exposure, bias, confounding factors, and strength of the results, with an overall score ranging from 0 (low quality) to 11 (high quality). The Strengthening the Reporting of Observational Studies in Epidemiology (STROBE) statement was used to determine the quality of reporting in the included studies (von Elm et al., 2014). The STROBE statement includes 34 items, with scores ranging from 0 (low quality) to 22 (high quality). A higher total score represents a higher quality. Two trained assessors examined each included study (C.-C.L. and Y.-J.C.), and scores were based on all information available from the studies.
Data Extraction and Synthesis
Data extraction was completed independently by the first reviewer (C.-C.L.) and then reviewed by the second reviewer (S.-C.S.) to ensure accuracy. Relevant data extracted from eligible studies included the study population’s demographic characteristics, sample size, treatment, details of the study design, characteristics of the measures, and outcomes. In addition, the correlation coefficient derived from the association between CRF and muscle strength and/or body composition was extracted when the result was reported. Advantages and disadvantages of muscle strength and body composition measures were compared across the studies. Any disagreements about study eligibility among reviewers or differences between the two sets of information extracted were resolved through discussion.
Data Analysis
Statistical analysis of correlative outcomes was conducted using Comprehensive Meta-Analysis software, version 3.5 (Goh et al., 2016). The correlation coefficient from each study was Fisher Z, transformed to be suitable for pooling. Standard error and 95% confidence intervals (CIs) were calculated and weighted (dependent on the sample size). Fisher Z and chi-square values were then calculated to determine the p value of the overall effect size across the studies. Heterogeneity across studies was determined using a Cochran’s Q test, which was transformed into an I2 percentage (0%–100%), with thresholds set at 25% for low heterogeneity, 50% for moderate heterogeneity, and 75% or higher for high heterogeneity (Borenstein et al., 2021). When high heterogeneity was detected, a random-effects model was performed; otherwise, a fixed-effects model was used (Barili et al., 2018). Publication bias could not be tested because of the small number of studies included in the meta-analysis (Goh et al., 2016).
Results
Characteristics of Included Studies
An overview of the study selection strategy and reasons for exclusion are shown in Figure 1. The abstracts of 7,459 articles on muscle strength, body composition, and CRF were screened for eligibility. The full texts of 62 studies was obtained to determine eligibility. Thirty-seven studies did not provide results about the association of fatigue with muscle strength and body composition, and the full text of one study was not available. A meta-analysis of the 25 included studies was conducted to identify the direction of the correlation and its consistency. 
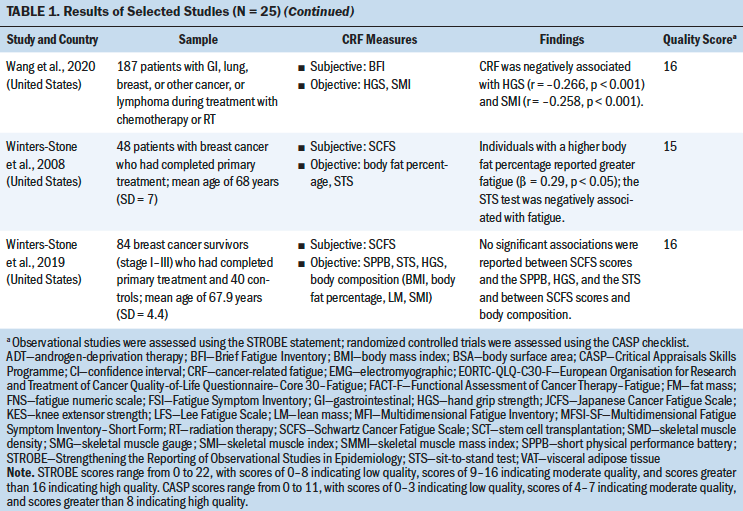
Most studies used a cross-sectional design (n = 21), three studies used a longitudinal design, and one study was an RCT. Total sample sizes ranged from 19 to 565, and the mean ages of participants ranged from 40.2 to 68 years. The majority of the studies were conducted in the United States (n = 11). The most frequently studied patient groups were those with breast (n = 13), gastrointestinal (n = 8), lung (n = 6), and gynecologic cancers (n = 3). Eleven studies focused on patients who were receiving cancer treatment (Guest et al., 2013; Inglis et al., 2020; Kilgour et al., 2013; Kisiel-Sajewicz et al., 2013; Kumar et al., 2004; Morishita et al., 2018; Neefjes et al., 2017; Newton et al., 2018; Van Weert et al., 2006; Veni et al., 2019; Wang et al., 2020), five studies included patients who had completed chemotherapy (Basen-Engquist et al., 2009; Kalter et al., 2016; Tonosaki, 2012a; Winters-Stone et al., 2008, 2019), three studies included patients who were scheduled for chemotherapy (Aleixo et al., 2020; Coleman et al., 2011; Tonosaki, 2012b), and two studies included patients who were receiving palliative care (Brown et al., 2005; Schvartsman et al., 2017).
Study Quality
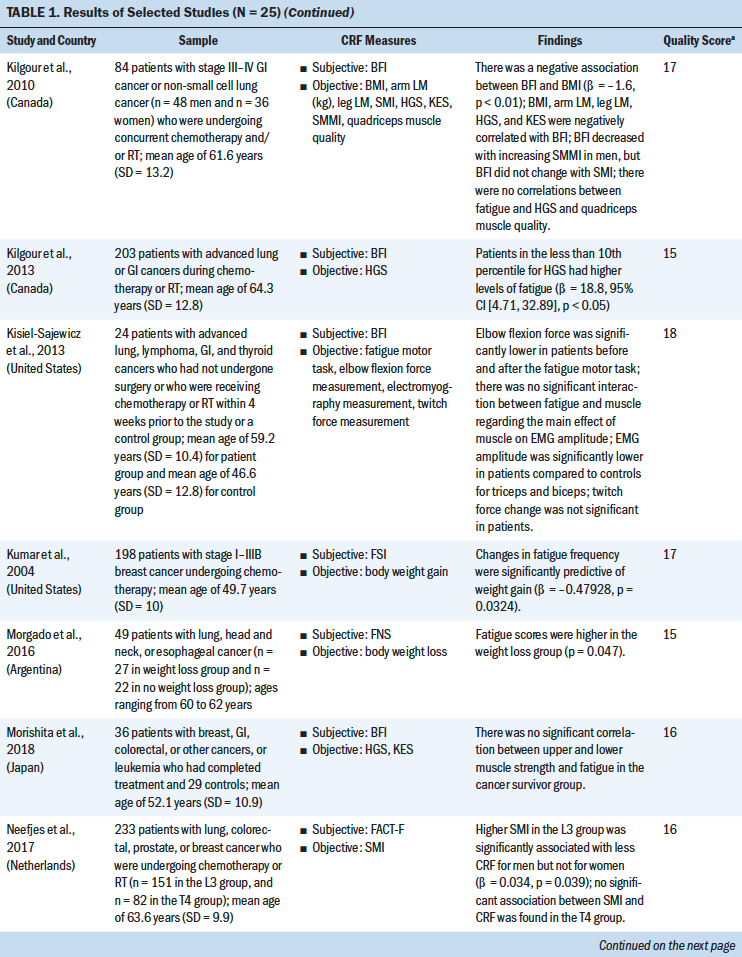
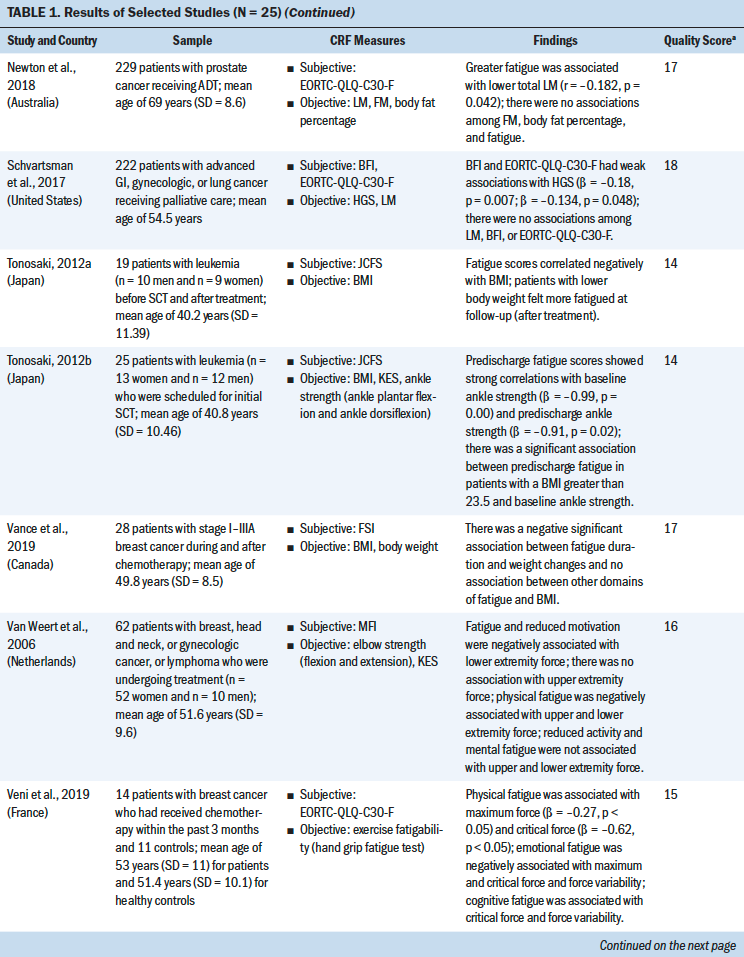
Study quality was assessed using the STROBE statement. Quality scores for the 24 observational studies ranged from 14 to 18 (indicating moderate to high quality). The CASP checklist was used to assess the one RCT study, which received a score of 9 (indicating high quality) (see Table 1). The quality of the selected studies was considered to be moderate to good. Most of the studies adequately reported the demographics of the study population and study setting (Aleixo et al., 2020; Brown et al., 2005; Coleman et al., 2011; Dhruva et al., 2010; Inglis et al., 2020; Kalter et al., 2016; Kilgour et al., 2013; Morishita et al., 2018; Neefjes et al., 2017; Tonosaki, 2012a, 2012b; Veni et al., 2019; Wang et al., 2020; Winters-Stone et al., 2019). One study had a small sample size (n = 14) (Tonosaki, 2012b). Eight studies statistically controlled the confounding variables in their analysis. Eight studies were adjusted for age (Aleixo et al., 2020; Basen-Engquist et al., 2009; Dhruva et al., 2010; Inglis et al., 2020; Kalter et al., 2016; Kilgour et al., 2010, 2013; Neefjes et al., 2017); four studies were adjusted for gender (Kalter et al., 2016; Kilgour et al., 2010, 2013; Neefjes et al., 2017); four studies were adjusted for treatment type and treatment status (pre-, during, and post-) (Basen-Engquist et al., 2009; Inglis et al., 2020; Kilgour et al., 2013; Neefjes et al., 2017); two studies were adjusted for cancer stages (Basen-Engquist et al., 2009; Inglis et al., 2020); one study was adjusted for anxiety, depression, and sleep disturbance (Dhruva et al., 2010); one study was adjusted for body mass index (BMI) (Dhruva et al., 2010); and one study was adjusted for Karnofsky Performance Status scores and exercise status (Inglis et al., 2020). 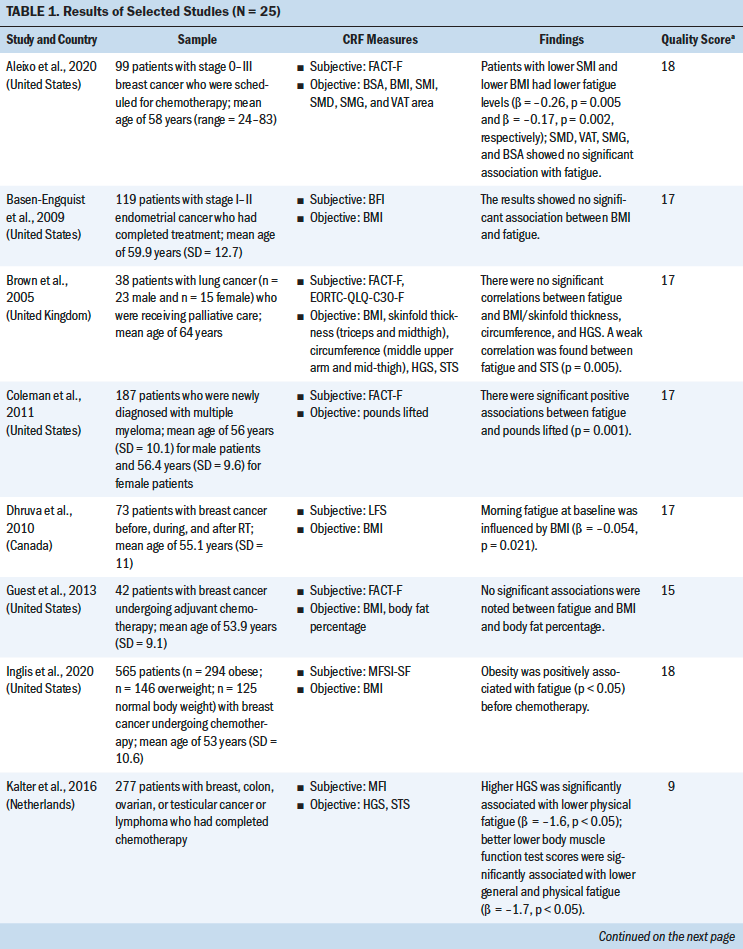
Fatigue Subjective Measures
A total of 10 self-report outcome measures were used to assess fatigue among the 25 studies. The three most frequently used subjective fatigue assessment measures were the Brief Fatigue Inventory, which was used in seven studies (Basen-Engquist et al., 2009; Kilgour et al., 2010, 2013; Kisiel-Sajewicz et al., 2013; Morishita et al., 2018; Schvartsman et al., 2017; Wang et al., 2020); the Functional Assessment of Cancer Therapy–Fatigue, which was used in five studies (Aleixo et al., 2020; Brown et al., 2005; Coleman et al., 2011; Guest et al., 2013; Neefjes et al., 2017); and the European Organisation for Research and Treatment of Cancer Quality-of-Life Questionnaire–Core 30–Fatigue, which was used in four studies (Brown et al., 2005; Newton et al., 2018; Schvartsman et al., 2017; Veni et al., 2019).
Meta-Analysis of Muscle Strength and Body Composition Measures
Nineteen different measures of muscle strength and body composition were used across the 25 studies being analyzed. Nine muscle strength measures were identified, including hand grip strength (HGS), knee extensor strength (KES), the sit-to-stand (STS) test, ankle strength, pounds lifted, the elbow flexion task, the fatigue motor task, the hand grip fatigue test, and the short physical performance battery. Ten body composition measures were identified, including BMI, the skeletal muscle index (SMI), body weight (BW), lean mass (LM), body fat percentage, hand grip muscle quality, quadriceps muscle quality, skeletal muscle density, skinfold thickness, and mid-arm muscle circumference. The advantages and disadvantages of each measure and the association between each muscle strength or body composition measure and CRF were reviewed based on the content of the studies (see Table 2). 

Muscle Strength
Three muscle strength measures (HGS, KES, and the STS test) were examined for their correlation with CRF using a meta-analysis (see Table 3). 
HGS was most commonly used to measure upper extremity strength using a hand grip dynamometer with an adjustable grip dynamometer. Nine studies used HGS to examine the relationship between fatigue and upper limb strength (Brown et al., 2005; Kalter et al., 2016; Kilgour et al., 2010, 2013; Morishita et al., 2018; Schvartsman et al., 2017; Veni et al., 2019; Wang et al., 2020; Winters-Stone et al., 2008). The mean range of HGS was 18.5–32.7 kg among patients with cancer. Six studies revealed a negative association between HGS and CRF among (a) individuals with cancer who were undergoing chemotherapy or radiation therapy (Kilgour et al., 2010, 2013; Veni et al., 2019; Wang et al., 2020), (b) individuals who had completed their cancer treatments (Kalter et al., 2016), or (c) individuals who were receiving palliative care (Schvartsman et al., 2017). Three studies showed no correlation between HGS and CRF among cancer survivors (Brown et al., 2005; Morishita et al., 2018; Winters-Stone et al., 2019). The meta-analysis using a fixed-effects model showed a negative summary correlation (r = –0.199, 95% CI [–0.263, –0.135], p < 0.001), with low heterogeneity of effect size (Q = 7.611, p = 0.268, I2 = 21.7).
Mean KES, which was measured with an isokinetic dynamometer (Kilgour et al., 2010) or isometric handheld dynamometer (Morishita et al., 2018; Tonosaki, 2012a; Van Weert et al., 2006), ranged from 14.9 to 31.2 kg. Three studies found a negative correlation between KES and CRF among patients who were preparing for or who were undergoing anticancer treatments (Kilgour et al., 2010; Tonosaki, 2012a; Van Weert et al., 2006), whereas one study revealed no correlation between KES and CRF among cancer survivors (Morishita et al., 2018). The meta-analysis using a fixed-effects model revealed a negative correlation (r = –0.303, 95% CI [–0.446, –0.146]), with low heterogeneity of effect size (Q = 0.2638, p = 0.267, I2 = 24.183).
The STS test was the most commonly used method for examining lower extremity strength, with scores ranging from 8.36 to 19.1 seconds (Brown et al., 2005; Kalter et al., 2016; Winters-Stone et al., 2008, 2019). Three studies indicated a significant negative correlation between the STS test and CRF among patients who had completed cancer treatment (Kalter et al., 2016; Winters-Stone et al., 2008) or who were receiving palliative care (Brown et al., 2005) after controlling for age and gender. One study revealed no correlation between the STS test and CRF among patients who had completed cancer treatment (Winters-Stone et al., 2019). The meta-analysis using a random-effects model revealed a negative correlation (r = –0.271, 95% CI [–0.45, –0.072], p < 0.001), with moderate heterogeneity of effect size (Q = 8.625, p = 0.035, I2 =65.216).
Body Composition
Five body composition measures (BMI, SMI, BW change, LM, body fat percentage) were examined for their correlation with CRF using a meta-analysis (see Table 4). 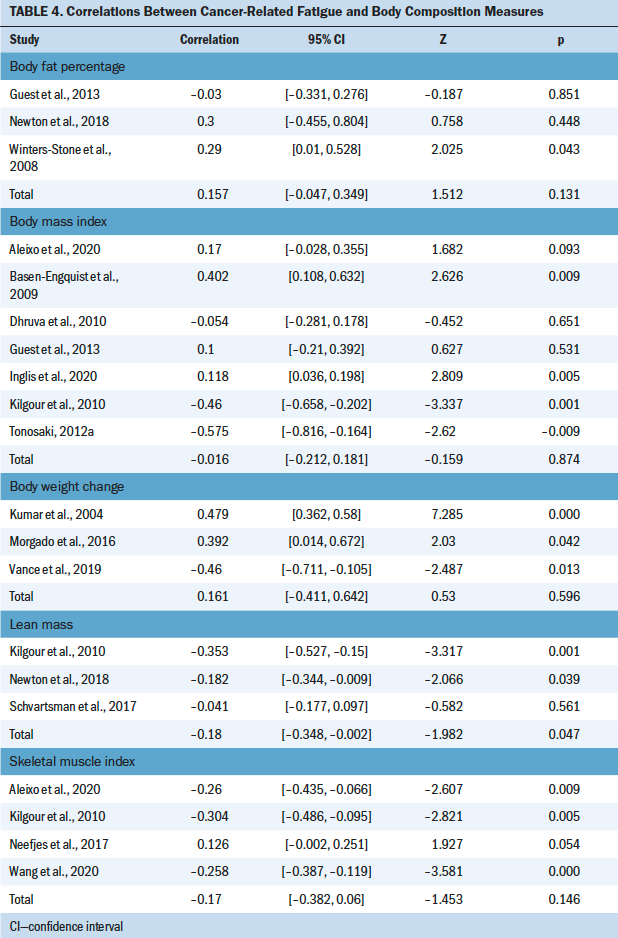
BMI was most commonly used to examine the correlation between body composition and CRF (Aleixo et al., 2020; Basen-Engquist et al., 2009; Dhruva et al., 2010; Guest et al., 2013; Inglis et al., 2020; Kilgour et al., 2010; Tonosaki, 2012a, 2012b; Winters-Stone et al., 2019). The mean range of BMI was 19.7–36.8 kg/m2. Of the nine studies that evaluated the correlation between BMI and CFR, three studies revealed a significant negative correlation among mixed cancer groups (Dhruva et al., 2010; Kilgour et al., 2010; Tonosaki, 2012a). In comparison, two studies found a positive correlation in the breast cancer group during chemotherapy treatment (Aleixo et al., 2020; Inglis et al., 2020), and four studies showed no correlation (Basen-Engquist et al., 2009; Guest et al., 2013; Tonosaki, 2012b; Winters-Stone et al., 2019). In addition, seven cross-sectional studies were included in the meta-analysis (Aleixo et al., 2020; Basen-Engquist et al., 2009; Dhruva et al., 2010; Guest et al., 2013; Inglis et al., 2020; Kilgour et al., 2010; Tonosaki, 2012a), excluding Tonosaki (2012b) and Winters-Stone et al. (2019) because of the absence of raw data. The random-effects model revealed nonsignificant correlation with the heterogeneity of effect size (Q = 31.106, p = < 0.001, I2 = 80.71).
Four studies evaluated the correlation between SMI and CRF (Aleixo et al., 2020; Kilgour et al., 2010; Neefjes et al., 2017; Wang et al., 2020). The meta-analysis with the random-effects model showed no significant association between SMI and CRF (heterogeneity of effect size: Q = 22.93, p < 0.001, I2 = 86.919). Three studies evaluated the correlation between BW change and CRF (Kumar et al., 2004; Morgado et al., 2016; Vance et al., 2019). No significant association between BW change and CRF (heterogeneity of effect size: Q = 23.011, p < 0.001, I2 = 91.308) or LM and CRF (heterogeneity of effect size: Q = 6.401, p = 0.041, I2 = 68.755) was indicated in the meta-analysis with the random-effects model (Kilgour et al., 2010; Newton et al., 2018; Schvartsman et al., 2017). Three studies evaluated the correlation between body fat percentage and CRF (Guest et al., 2013; Newton et al., 2018; Winters-Stone et al., 2008). The meta-analysis with a fixed-effects model showed no significant association between body fat percentage and CRF (heterogeneity of effect size: Q = 2.42, p = 0.2971, I2 = 17.532).
Discussion
To the authors’ knowledge, this review is the first to systematically appraise and summarize the evidence on muscle strength and body composition measures as potential indicators for CRF. This review found that HGS, KES, and the STS test may be potential indicators for assessing CRF. HGS was the most commonly used method to examine the correlation with CRF and revealed a significant negative association in the meta-analysis. KES and the STS test were the most commonly used methods to measure lower extremity strength, and the meta-analysis showed a negative association with CRF. BMI was most commonly used among body composition measures; however, the meta-analysis indicated a nonsignificant correlation with CRF.
HGS demonstrated a significant negative association with CRF. HGS is a preferred performance measure because it is rapid, straightforward, inexpensive, and noninvasive to implement (Taekema et al., 2010). HGS is also significantly associated with overall body strength (Taekema et al., 2010; Wind et al., 2010); therefore, it is considered to be a potential indicator for CRF. However, some selected studies reported a nonsignificant association (Brown et al., 2005; Morishita et al., 2018; Winters-Stone et al., 2019). Poole et al. (2016) argued that maximum grip strength is not related to metabolic exercise intensity domains and fatigue development. They further indicated that critical force describes the relationship of muscle force–duration, which allows for identifying a fatigue threshold (Poole et al., 2016). Veni et al. (2019) examined the correlation between CRF and critical force and the maximum force of hand grip and found that critical force strongly correlates with CRF; maximum force was revealed to be nonsignificant. The relationship between critical force (muscle force–duration) and fatigue mechanisms needs further investigation.
KES and the STS test were most commonly used to examine the relationship with CRF, and it has been reported that CRF is significantly associated with lower extremity strength. Several studies demonstrated that decreased lower extremity strength in patients tended to be associated with lower physical function and higher levels of CRF (Brown et al., 2005; Kalter et al., 2016; Tonosaki, 2012a; Van Weert et al., 2006; Winters-Stone et al., 2008). Lee et al. (2017) indicated that physical activity and activities of daily living were strongly associated with lower extremity strength. Activities, such as walking, stair climbing, and getting up from a chair, require adequate muscle strength and balance function, which suggests that lower limb muscle strength and function may be important intervention targets when aiming to reduce fatigue and improve physical function (Bower et al., 2018).
Isokinetic dynamometry and handheld dynamometry were two instruments used to objectively measure KES in the included studies. The handheld dynamometer was more frequently used to measure lower extremity muscle strength (Morishita et al., 2018; Tonosaki, 2012b; Van Weert et al., 2006); only one study reported using an isokinetic dynamometer to measure KES (Kilgour et al., 2010). Whiteley et al. (2012) indicated that when considering ease of use, portability, cost, and compact size, a handheld dynamometer can be a reliable and valid instrument for muscle strength assessment in a clinical setting. A systematic review by Stark et al. (2011) examined the correlation between handheld and isokinetic dynamometry and demonstrated minimal differences between the two tests. Stark et al. (2011) also reviewed the handheld dynamometer’s reliability and validity in healthy populations and found that various studies revealed a lack of homogeneity in methodology for applying a handheld dynamometer, underlying the need for a standard protocol. Reese (2005) reported that studies that do not standardize the muscle testing techniques might result in poor outcomes.
Results from the meta-analysis of BMI and BW indicated a nonsignificant correlation with CRF in this review. Several studies revealed that a higher level of fatigue was negatively associated with lower BMI (Dhruva et al., 2010; Kilgour et al., 2010; Tonosaki, 2012b), whereas other studies indicated that a higher level of fatigue was positively associated with higher BMI among patients with cancer (Aleixo et al., 2020; Inglis et al., 2020). Similarly, Vance et al. (2019) and Morgado et al. (2016) found that more significant levels of fatigue and longer fatigue duration were associated with BW loss, whereas Kumar et al. (2004) found that based on the Fatigue Symptom Inventory, duration of fatigue was positively correlated with weight gain. It should be noted that the conflicting results among those studies may be because of reduced physical activity over time. Several follow-up studies in patients with leukemia found that patients with higher fatigue had gained weight during hospitalization but lost weight after returning home (Tonosaki, 2012a, 2012b). Decreased activity and movement while receiving anticancer treatment during hospitalization may contribute to weight gain (Schvartsman et al., 2017). However, BMI is an indirect way to assess body composition, and it does not discriminate between adiposity and fat-free mass or reflect the distribution of these components in the body (Okorodudu et al., 2010). Using combinations of BMI and advanced body composition measures, such as dual-energy x-ray absorptiometry, computed tomography, or magnetic resonance imaging, can improve the differentiation of the multiple components of body composition (Toomey et al., 2015).
The majority of studies were focused on individuals who were White, and only three studies recruited non-White participants. None of the studies discussed the relationship between CRF and muscle strength or body composition measures across populations from different countries. Swen et al. (2017) highlighted that racial disparities in CRF, muscle strength, and body composition might exist. Several studies also indicated that Black women with breast cancer particularly experience greater levels of CRF than women of other racial/ethnic groups. This could be because Black women may undergo more aggressive treatment regimens because they are more likely than women of other races to be diagnosed with late-stage breast cancer (Carey et al., 2006; Swen et al., 2017). Marzetti et al. (2018) found that muscle mass and muscle strength were significantly greater among Italian participants compared to healthy Taiwanese patients. Studies that include multiple races should consider that differences may reflect disparities in lifestyle, nutritional or environmental exposures, and cultural backgrounds (Mountain & Risch, 2004). It also should be noted that there is significant disagreement in the cutoff point value of different measures (muscle strength or body composition) in different races (Carey et al., 2006; Chen et al., 2014).
Participant age ranges are another crucial consideration when comparing results across studies. Participant ages in the included studies ranged from 40.2 to 68 years. Abe et al. (2016) indicated that muscle strength showed no difference among those aged 20–49 years but revealed significantly lower results in older age groups. Batsis and Villareal (2018) reported that loss of strength and muscle mass was higher among adults aged 60 years or older when compared to other ages. Therefore, comparing results across a wide range of ages may not be appropriate. Additional research examining the relationship between CRF and muscle strength in various age groups is needed.
The consideration of nutritional status and peripheral neuropathy, such as chemotherapy-induced or diabetes-related causation, on the relationship between CRF and muscle strength and body composition was not discussed in the selected studies. A cross-sectional study by Guest et al. (2013) examined the association between diet components and CRF in breast cancer survivors and found that CRF was positively associated with fat intake and inversely related to fiber and carbohydrate intake. Kilgour et al. (2010) also found that a low albumin level was significantly correlated to increased CRF and low muscle mass, respectively. The effects of cancer-related symptoms, such as peripheral neuropathy, on fatigue need to be considered. Individuals with cancer who are receiving chemotherapy may experience peripheral neuropathy, with symptoms such as tingling or numbness of the hands or feet or a weak and heavy feeling in the arms and legs affecting muscle strength (Beijers et al., 2014). As a result, nutritional factors and peripheral neuropathy should be considered when examining the relationship between CRF and muscle strength and body composition.
The selection of CRF indicators could not be sufficiently determined through the cross-sectional studies in this review. The determination of the cutoff values of the selected measures should also be based on longitudinal, outcomes-based studies. Although this review included mostly cross-sectional studies and only one RCT, the findings provide insight that may guide future research. Discrepancies across studies may have resulted partially because CRF accounts for complex factors, such as demographic characteristics, treatment status, type of treatment, cognitive status, distress, or spiritual suffering in patients with cancer (Berger et al., 2012). Age and gender were the most commonly controlled confounding factors among the selected studies. Age was associated with muscle mass loss and strength among older individuals, but gender was not significantly associated with CRF and muscle strength (Kalter et al., 2016; Kilgour et al., 2010, 2013). HGS, KES, and the STS test may be indirect indicators for CRF but still act as vital predictive indicators in CRF assessment (Kalter et al., 2016). Therefore, future studies are necessary to clarify the moderating role of muscle strength.
Limitations
This review has several limitations. The majority of studies used a cross-sectional design, with a single time point measure, so the identified relationships can be interpreted as associations only. Subsequent studies should consider adopting longitudinal designs to highlight the causal relationship between muscle strength and body composition and CRF.
It is vital to evaluate the reliability and validity of the muscle strength and body composition measures and select a reliable measure to ensure consistency. However, the studies included in this review were not designed to examine reliability, validity, and responsiveness (changes over time). As a result, this review could not evaluate preferred measures for CRF. Additional studies focused on these properties are needed.
The correlation between muscle strength and body composition measures and CRF was examined using different analytical approaches and various methods of statistical analyses, posing difficulty in comparing and synthesizing results. Associations of muscle strength and fatigue need further research. This review also included multiple types of cancer in different stages of treatment. Significantly different cancer types are associated with heterogeneous symptom profiles; therefore, the findings must be interpreted with caution when extrapolated for use with one particular cancer type.
Implications for Nursing
Because current CRF measures in clinical settings are mainly subjective self-report scales, objective measures might help to assess CRF more concretely. The evidence revealed significant correlations between HGS, KES, and the STS test and CRF, so these muscle strength measures might be potential indicators for assessing CRF in patients. HGS, KES, and the STS tests were rapid and straightforward to use, which might help clinical professionals to better assess CRF and develop improved interventions. Objective and subjective assessments of CRF have their own advantages and disadvantages. Combining objective and subjective measures of fatigue could not only provide a more holistic understanding of CRF but also assist clinical professionals in addressing CRF more accurately and evaluating the effectiveness of current interventions. ![]()
Conclusion
Although CRF is a complex and multifactorial symptom and its specific etiology remains unclear, this systematic review provided evidence supporting that there are potential objective indicators for assessing CRF in patients with cancer. HGS, KES, and the STS test were the most commonly used muscle strength measures and, based on the results of the meta-analysis, were found to be potential objective CRF indicators. These measures were also determined to be easy to assess and use for both clinicians and patients. Although the meta-analysis with fixed-effects model revealed that CRF was negatively correlated with HGS, KES, and the STS test, there were no significant correlations between CRF and body composition measures. Future studies should investigate the sensitivity, reliability, and validity of objective CRF measures, as well as consider the effect of age differences on muscle strength.
About the Author(s)
Chia-Chien Li, RN, MSN, is a doctoral candidate, Yun-Jen Chou, RN, PhD, is a postdoctoral fellow, and Shiow-Ching Shun, RN, PhD, is a professor, all in the School of Nursing in the College of Medicine at National Taiwan University in Taipei. No financial relationships to disclose. Li and Shun contributed to the conceptualization and design and provided statistical support and the analysis. Li completed the data collection. All authors contributed to the manuscript preparation. Shun can be reached at scshun@ntu.edu.tw, with copy to ONFEditor@ons.org. (Submitted February 2021. Accepted May 1, 2021.)